by Lori Berson | Jul 15, 2025 | Marketing, Marketing Strategy
Key Takeaways
-
Full-Time Marketing Hires Come With Hidden Costs
-
6+ months to recruit, onboard, and ramp up.
-
High overhead: salary, equity, benefits, and sunk onboarding costs.
-
Risk of early churn, many leave within 24 months.
-
Limited perspective from a single individual.
-
Delays = Lost Revenue and Momentum
-
The longer it takes to get leadership in place, the more growth opportunities slip by.
-
Time lost during hiring is rarely accounted for, but always expensive.
-
Fractional CMOs Offer Senior-Level Strategy Without Full-Time Commitment
-
Ready to deliver from day one, no learning curve.
-
Executive-level insight, cross-functional experience, and wide network access.
-
Can flex with business needs, no long-term contracts or fixed overhead.
-
Fractional = Smarter Spend
-
You pay for outcomes, not office presence.
-
No benefits packages, equity dilution, or infrastructure investment.
-
Hiring Smarter Drives Faster Growth
-
Businesses that opt for fractional leadership often see quicker traction and more focused execution.
-
It’s not just a budget decision, it’s a velocity play.
-
You Don’t Have to Guess – Run the Numbers
-
Modern Companies Are Rewriting the Hiring Playbook
-
Fractional leadership is becoming a go-to strategy for lean, fast-moving organizations.
-
What used to be seen as “interim” is now “advantageous.”
-
The Bottom Line:
-
If speed, strategy, and flexibility are critical to your next stage of growth, a Fractional CMO may be the best hire you don’t make.
Full-Time or Fractional Marketing Leadership? The Decision That Could Change Your Growth Trajectory
Picture this: You’re gearing up for your next phase of growth. You need marketing firepower…fast. The default move? Hire a full-time CMO or VP of Marketing. It feels like the responsible, strategic decision. But what if it’s actually costing you more and slowing you down?
Let’s flip the script.
The Full-Time Fallacy: Why “Safe” Can Be Costly
Hiring a full-time executive is often seen as a milestone. But it comes with hidden baggage.
Here’s the fine print no one talks about:
-
Hiring Takes Forever: Six months (or more) to recruit, interview, onboard, and hope they work out.
-
You Pay for Potential, Not Performance: Salary, equity, benefits, onboarding, and… time. Lots of it.
-
High Churn, Low ROI: Many FTEs bounce within 24 months. That’s a big bet for uncertain returns.
-
Limited Perspective: You get one person, one background, one network. What happens when you need range?
And while you’re waiting for that FTE to hit their stride? Opportunities slip through the cracks. Revenue gets left on the table. Your team is left spinning its wheels.
Enter the Fractional CMO: Leadership Without the Lag
A Fractional CMO is not a compromise. It’s a catalyst.
Instead of locking yourself into a long-term overhead-heavy commitment, you get:
-
Immediate Strategy + Execution: No “getting up to speed.” They’re already moving.
-
Cross-Industry Perspective: Fresh insights from multiple markets and business models.
-
Scalable Engagements: Need 10 hours this month and 30 next? Done. No sunk costs.
-
Executive-Level Thinking Without the Salary Drain: You get seniority, without paying for office snacks and 401(k) matching.
It’s like hiring the expert you wish you had on your exec team, without the red tape.
Still Unsure? Let’s Talk Numbers
We’ve built a Cost Comparison Calculator to help you compare the total cost of a full-time hire versus a Fractional CMO. Spoiler alert: one of them is significantly more flexible, faster, and financially savvy.
👉 See the Cost Comparison Calculator Here
The New Growth Playbook Is Lean, Fast, and Smart
Fractional marketing leadership is no longer a fringe concept. It’s the secret weapon behind today’s fastest-growing companies.
So ask yourself:
-
Do you want to spend time and money, or gain momentum?
-
Do you need marketing leadership that fits a job description, or your current reality?
If the answer leans toward speed, strategy, and smarter investment, a Fractional CMO might be the most powerful hire you don’t make.
If you’re ready to grow without dragging your feet (or draining your budget), let’s chat. Schedule a call or email Lori at lberson@BersonDeanStevens.com to explore how fractional leadership could unlock serious results for your business.
BersonDeanStevens (BDS) has been developing creative, results-driven marketing strategies, content, campaigns, and programs for over 25 years. And, we bring the knowledge and expertise to incorporate AI when necessary to gain efficiencies and help boost results. Whether you’re looking for a fractional CMO, need assistance when your internal workforce is overloaded, or need consulting from time to time, BDS is the perfect go-to resource. Client list.

by Lori Berson | Jun 12, 2025 | Marketing, Marketing Strategy
Key Takeaways
1. Marketing Teams Without Leadership Stall
When teams are overwhelmed and lack clear direction, productivity dips. A fractional CMO offers strategic guidance that aligns and empowers your team, transforming chaos into coordination.
2. Plateaued Growth Is a Red Flag
If your marketing efforts have stopped delivering results, it’s time for a fresh perspective. A fractional CMO can identify bottlenecks and reignite your growth engine.
3. Big Business Moves Demand Sharp Strategy
Expanding, rebranding, or merging? These transitions require seasoned marketing leadership. Fractional CMOs are experts at steering companies through complex change with confidence.
4. Marketing Shouldn’t Be Everyone’s Side Hustle
When marketing falls to whoever has a spare minute, results suffer. A fractional CMO provides dedicated, expert leadership, unifying your message and maximizing ROI.
5. Executive Insight Without the Price Tag
Hiring a full-time CMO is costly. A fractional CMO delivers strategic firepower, plus the latest in AI and automation, without the bloated expense.
6. Scaling Fast? Your Marketing Should Too
Rapid growth exposes a weak marketing infrastructure. A fractional CMO builds scalable systems that grow with your business, not behind it.
7. Expertise Has Evolved
Modern marketing is as technical as it is creative. Fractional CMOs bring deep expertise in automation, analytics, and AI-driven decision-making.
8. Planning a Big Spend? Get a Big Brain
Large marketing investments require high-level oversight. A fractional CMO ensures smart allocation and optimized ROI—think compound interest for your marketing dollars.
You don’t need a full-time CMO to lead like one. Fractional CMOs blend strategic acumen with tech-savvy tools, providing leadership that matches your ambition at a fraction of the cost. The race is on. Time to shift into high gear.
You’re behind the wheel of a high-performance vehicle, but something’s off. The engine’s sputtering. You’re not hitting top speed. No matter how hard you press the gas, your competitors are zipping past in the rearview mirror. Sound familiar?
That’s exactly what happens when your marketing strategy lacks executive-level leadership. The good news? You don’t need to shell out a six-figure salary to get back in the race. Enter the fractional CMO, your secret weapon for strategic marketing leadership without breaking the bank.
1. Your Marketing Team Is Overwhelmed and Lacks Direction
When your marketers are stretched thinner than butter on toast, morale tanks, and so do results. Response times lag, deadlines slip, and strategy meetings are filled with blank stares.
Here’s the kicker: hard work isn’t the same as smart work. Without a clear strategic direction, even your most committed team members can waste energy spinning their wheels. A fractional CMO acts as the conductor of your marketing orchestra, making sure everyone plays the same tune instead of clashing solos.
2. Growth Has Hit a Wall
Remember when your marketing efforts felt like magic? Leads flowed, and ROI sparkled. Now? Crickets.
This plateau isn’t necessarily a reflection of market conditions or your product quality. Often, it signals that your current marketing strategy has maxed out. A fractional CMO brings fresh eyes and diagnostic skills to identify exactly where your growth engine has stalled, and, more importantly, restart your growth trajectory.
3. You’re Facing Major Business Transitions
Big changes, whether entering new markets, launching a bold product, or managing a merger, are make-or-break moments.
These transitions are exciting but high-risk. A fractional CMO knows how to realign messaging, re-focus teams, and turn disruption into opportunity.
4. Marketing Is Everyone’s Side Hustle
In many growing companies, marketing ends up on the CEO’s to-do list, or squeezed in by the sales director between calls. While well-intentioned, this fragmented approach rarely delivers stellar results.
With a fractional CMO, marketing becomes someone’s main job again. They bring focus, structure, and momentum to your efforts, ensuring campaigns are consistent, strategic, and on-brand.
5. You Need Expert Strategy Without the Executive Price Tag
Full-time CMOs often cost $200,000–$400,000 annually, before adding in bonuses, equity, and benefits. For many businesses, that’s a non-starter.
A fractional CMO offers the same level of insight and experience at a far more sustainable cost. You’re not settling for less, you’re investing smarter.
The Automation and AI Advantage: Today’s fractional CMOs bring cutting-edge technology that multiplies their impact exponentially. Smart automation handles repetitive tasks while AI analyzes customer data at superhuman speed. This technological leverage means you get enterprise-level sophistication without enterprise-level overhead.
6. Your Business Is Scaling Faster Than Your Marketing
Rapid growth should be a good problem, right? But when your marketing can’t keep pace with your ambitions, growth becomes a bottleneck. Processes that worked when you were smaller suddenly feel clunky, and systems break down.
A fractional CMO builds scalable marketing operations from day one, implementing systems that anticipate growth rather than react to it. When your business doubles, your marketing efficiency doesn’t just keep pace; it often improves.
7. You Lack Sophisticated Marketing Expertise
Your internal team might excel at execution, but today’s marketing requires different strategic thinking. Understanding AI-powered customer insights, building automated nurture sequences that feel personal at scale, or orchestrating omnichannel campaigns that adapt in real-time, these aren’t plug-and-play skills.
A fractional CMO brings expertise in the technologies that will define marketing’s future, preparing your team for tomorrow’s opportunities while solving today’s challenges.
8. You’re Planning Major Marketing Investments
Upping your marketing budget? Adding new tools? Growing your team?
Don’t wing it. A fractional CMO provides the guidance to allocate resources effectively and avoid costly mistakes. But more importantly, they implement systems that make every future dollar more effective than the last. Think compound interest, but for marketing ROI.
The Smart Money Play
The magic of the modern fractional CMO? They blend human strategy with digital firepower. AI finds the patterns. The CMO finds the meaning—and the opportunity.
The businesses that win aren’t just spending more. They’re spending smarter, guided by strategy, powered by technology, and scaled by experience.
The Time Is Now
Marketing isn’t getting simpler, but the opportunity is clear. The businesses leveraging fractional leadership, automation, and AI aren’t just keeping up, they’re pulling ahead.
If any of these scenarios hit close to home, you’re already ahead, you’ve identified the need. Now’s the moment to act.
Ready to shift into overdrive?
Contact Lori at BersonDeanStevens and discover how a fractional CMO can transform your marketing from a cost center into your biggest growth driver—without the executive price tag.
Don’t let another quarter pass while your competition gains ground. Your marketing strategy deserves leadership that matches your ambition, technology that amplifies your impact, and a price point that makes strategic sense.
The future of marketing is already here. Will you lead it, or let it leave you behind?
Ready to accelerate your marketing? Let’s talk about how a Fractional CMO can unlock growth smarter, faster, and more cost-effectively. Schedule a call or email Lori at lberson@BersonDeanStevens.com.
BersonDeanStevens (BDS) has been developing creative, results-driven marketing strategies, content, campaigns, and programs for over 25 years. And, we bring the knowledge and expertise to incorporate AI when necessary to gain efficiencies and help boost results. Whether you’re looking for a fractional CMO, need assistance when your internal workforce is overloaded, or need consulting from time to time, BDS is the perfect go-to resource. Client list.

by Lori Berson | May 12, 2025 | Marketing, Marketing Strategy
Growth demands more than budget, it demands a smart, scalable strategy powered by automation and AI. If your business needs executive-level marketing leadership without the long-term overhead, a Fractional CMO offers the ideal solution.
What Is a Fractional CMO?
A Fractional Chief Marketing Officer (CMO) is a seasoned executive who partners with your business part-time to drive high-impact marketing strategy, execution, and team development, without the cost or complexity of a full-time role.
Core Responsibilities:
- Align marketing with business goals.
- Lead digital and brand transformation.
- Develop go-to-market strategies.
- Leverage AI and automation for efficiency.
- Build and mentor internal teams.
- Manage performance metrics and vendors.
Why Growth-Minded Companies Are Choosing Fractional CMOs
1. Executive Strategy, Lower Overhead
A full-time CMO can cost $150,000+ per year. A Fractional CMO offers similar strategic impact for up to 80% less, typically ranging from $36,000 to $72,000 annually (approximately 10-20 hours/month) based on scope and engagement level – freeing up budget for campaigns, technology, and talent.
2. Faster Time-to-Impact
Fractional CMOs move fast. They onboard quickly, assess your business, and begin implementing a results-driven strategy in weeks, not months.
3. Fresh, Cross-Industry Insights
With experience across B2B, SaaS, e-commerce, CPG, and professional services, these leaders bring diverse strategies and apply AI-powered insights and automation to create a competitive advantage, often uncovering opportunities your internal team may overlook.
What a Fractional CMO Delivers
Strategic Planning
Effective planning blends human insight with machine-driven efficiency. Fractional CMOs:
- Analyze markets and forecast emerging trends.
- Personalize messaging at scale.
- Prioritize campaigns based on predictive lead scoring.
- Automate content workflows and scheduling.
Digital Execution & Automation
Your Fractional CMO leads digital transformation by:
- Optimizing website performance and user experience.
- Creating email campaigns that adapt based on real-time behavior.
- Automating lead-nurturing sequences.
- Enhancing CRM and marketing automation systems.
- Continuously improving campaign performance.
- Delivering actionable reporting and analytics.
Team Leadership & Skill Development
Fractional CMOs assess your team’s strengths and gaps and close those gaps with targeted hiring, coaching, and AI-enhanced workflows. They:
- Hire and mentor marketing talent.
- Upskill your in-house team.
- Train teams on using AI tools.
- Implement workflow automations to reduce repetitive tasks.
- Help teams focus on strategic thinking, not tactical busywork.
- Establish clear structure, processes, and KPIs.
Performance Management
Measurement is core. Your CMO will:
- Set up optimization using tools like GA4 and Salesforce.
- Use AI models to forecast results and guide decisions.
- Provide monthly reporting tied directly to business goals.
Vendor & Tech Stack Management
Need outside help? A Fractional CMO will:
- Source and manage marketing vendors.
- Evaluate and optimize your martech stack.
- Negotiate favorable contracts using industry benchmarks.
- Integrate platforms for CRM, content, and paid media.
How to Get Started and What to Expect
Phase 1: Discovery
Your Fractional CMO conducts a comprehensive audit of:
- Business goals, target audiences, competitors, and key challenges.
- Brand messaging and customer journey.
- Martech stack and data infrastructure.
- Current performance metrics and growth blockers.
Phase 2: Strategy Development
They deliver a comprehensive, tailored plan that includes:
- Brand Positioning – Defining your market edge and core message.
- Marketing Goals – Establishing clear, measurable targets aligned with growth.
- KPIs – Identifying metrics to track and optimize success.
- Channel Strategy – Determining where and how to engage your audience.
- Budget Allocation – Using resources strategically to maximize ROI.
Phase 3: Team Collaboration
- Clearly define roles and responsibilities.
- Share expertise, including AI and automation best practices.
- Establish a consistent communication cadence to ensure alignment.
Phase 4: Execution & Optimization
Your CMO oversees implementation, monitors performance, and continuously refines strategies using data and automation.
Real-World Impact
“A fractional CMO can provide the strategic guidance and leadership that businesses need to scale, at a fraction of the cost and commitment.”
—John Jantsch, Duct Tape Marketing
- A law firm increased qualified leads by 40% in six months.
- A SaaS company improved email engagement by 25%.
- A retail brand scaled new customer acquisition with 50% lower CAC.
Why Fractional Works
✅ Cost-Effective: Executive expertise at a fraction of the cost.
✅ Flexible: Scale engagement up or down based on business needs.
✅ Tech-Enabled: AI and automation for speed and scale.
✅ Results-Driven: Every decision is guided by measurable performance.
✅ Fast: Get to market quickly with expert-driven strategy.
✅ Innovative: Bring in fresh ideas and proven frameworks from other industries.
If your company is ready to scale its marketing without increasing overhead, a Fractional CMO delivers executive-level impact, tailored strategy, and measurable results. It’s the smart, scalable way to lead marketing.
Need to accelerate your marketing? Let’s talk about how a Fractional CMO can unlock growth smarter, faster, and more cost-effectively. Schedule a call or email Lori at lberson@BersonDeanStevens.com.
BersonDeanStevens (BDS) has been developing creative, results-driven marketing strategies, content, campaigns, and programs for over 25 years. And, we bring the knowledge and expertise to incorporate AI when necessary to gain efficiencies and help boost results. Whether you’re looking for a fractional CMO, need assistance when your internal workforce is overloaded, or need consulting from time to time, BDS is the perfect go-to resource. Client list.

by Lori Berson | Oct 10, 2024 | Marketing, Marketing Strategy, Web Site Design, Web Site Development
Transforming Your Website into a Marketing Powerhouse
Your website is more than a digital storefront; it’s the core of your marketing strategy and a vital driver of business growth. To harness its full potential, treat it as a dynamic, always-on marketing machine. By optimizing your site for engagement, lead nurturing and conversions, you can transform it into an essential business asset.
Elevating Your Digital Presence
An effective digital presence is crucial, not just for visibility but for strategically engaging customers at every stage of their journey. Here’s how a robust online strategy can support business growth:
- Enhanced Engagement: Go beyond a simple website touchpoint by creating experiences tailored to visitor preferences and behaviors, making customers feel valued.
- In-Depth Analytics: Advanced analytics tools provide insights into visitor behaviors and conversion paths, guiding data-driven adjustments that align your site’s performance with larger business objectives.
- Integrated Ecosystem: Your website should seamlessly connect with CRM, content management, and marketing automation tools, creating a cohesive customer journey across all touchpoints.
Building a High-Impact Website
A high-performing website is built on elements that create engagement and drive conversion:
- Impactful Homepage: Make a powerful first impression with a visually compelling and intuitive homepage that highlights your value, addresses customer pain points, and guides visitors towards desired actions.
- Content Ecosystem: Develop a library of high-quality content, from SEO-optimized blogs to thought leadership pieces, that reinforces your brand authority and keeps visitors engaged.
- Story-Driven ‘About’ Page: Use storytelling to connect with visitors. Share your brand’s mission and values, building trust and authenticity.
- Conversion-Focused Product and Service Pages: Build credibility and reduce buying hesitations by adding interactive demos, case studies, and reviews to your product or service pages.
- Campaign-Specific Landing Pages: Tailor landing pages for specific campaigns to optimize lead capture and conversions by aligning messaging and visuals with audience expectations.
Essential Website Enhancements for Success
Consider these key improvements to enhance engagement and drive conversions on your website:
- Instant Support via Chatbots
Chatbots and knowledge bases provide immediate, accurate responses, helping users stay engaged and informed.
- Interactive Features
Include live chats, virtual consultations, and product configurators for immersive, in-depth user experiences that mimic live interactions.
- Value-Driven Content
Focus on the unique benefits of your offerings. Case studies and tailored content show prospects how your product solves their specific challenges.
- Social Proof
Build trust with testimonials and case studies. Highlight success stories and showcase specific metrics to reinforce your authority.
- Visual Storytelling
Use quality visuals, like videos and infographics, to enhance engagement. Include real-world applications to help prospects envision using your product and/or service.
- Strategic Calls-to-Action (CTAs)
Place clear, action-oriented CTAs throughout your site, encouraging visitors to engage further, like scheduling a demo or downloading a case study.
- High-Value Content for Authority
Regularly publish content like blog posts and white papers that establish thought leadership and support SEO efforts, attracting high-intent visitors.
Cultivating Curiosity and Engagement
Static content alone isn’t enough for today’s audience. To keep engagement high:
- Use Dynamic Personalization to tailor experiences based on individual visitor behavior.
- Create Interactive Experiences that encourage deeper brand interaction.
- Integrate Rich Media like videos and infographics to capture attention and convey information effectively.
Mastering the Customer Journey
Crafting an effective customer journey on your site requires a strategic approach:
- Targeted Awareness: Attract the right visitors with precise, impactful messages.
- Deep Engagement: Keep them interested with content and tools that meet their needs.
- Compelling CTAs: Use strong calls to action that drive conversions.
- Personalized Retention: Tailor follow-ups and re-engagement strategies to build loyalty.
Leveraging Advanced Martech
Transforming your website into a powerful marketing tool often relies on advanced martech solutions:
- Content Management Systems (CMS): Platforms like Adobe Experience Manager and WordPress make content updates simple and enable cross-team collaboration.
- Customer Relationship Management (CRM): Systems like Salesforce provide real-time insights, enhancing customer data management and service.
- Marketing Automation Platforms (MAP): Use tools like HubSpot and ActiveCampaign to automate lead nurturing and campaign tracking.
- Comprehensive Analytics: Google Analytics and Tableau reveal actionable insights, helping you optimize your strategy.
- SEO Tools: Platforms like Ahrefs, SEMRush, and Moz analyze search trends and improve content for visibility.
- AI-Powered Personalization: Tools like Persado, Optimizely, and Coveo allow real-time customization of content and recommendations.
AI and Machine Learning for Personalized Journeys
AI and ML can significantly enhance customer experiences:
- Predictive Insights: AI tools analyze data to predict user behavior, allowing for proactive engagement.
- Recommendation Engines: ML algorithms suggest relevant content, improving satisfaction and conversions.
- Conversational AI: AI chatbots offer real-time guidance, improving user navigation and support.
- Omnichannel Synchronization: AI tools ensure a seamless experience across all digital channels, from website to social media.
Compliance and Trust
Data compliance is essential to maintain trust. Prioritize transparency, and invest in systems that respect user preferences and protect data:
- Clear Data Practices: Explain your data usage policies clearly to build user trust.
- Consent Management: Implement solutions that allow users to control their data.
- Robust Security: Protect user data with encryption and other security protocols.
Continuous Engagement Strategies
An always-on marketing engine should re-engage visitors and nurture lasting relationships with:
- Retargeting Campaigns: Use platforms like Google Ads to remind users of your offerings.
- Personalized Email Marketing: Send targeted emails with relevant content and offers based on user behavior.
- Social Media Engagement: Maintain a strong presence on LinkedIn, Twitter, TikTok, and Instagram to keep your brand top-of-mind.
- Push Notifications: Send timely alerts about updates and promotions, re-engaging users who have left your site.
Sustained Success
By aligning your martech, strategy, and team, your website can become a scalable, data-driven asset that drives long-term growth. It’s important to consistently analyze performance data, fine-tune your approach, and ensure a smooth, customer-centered journey that powers sustainable business expansion.
Ready to transform your website into a marketing machine? Schedule a call or email Lori at lberson@BersonDeanStevens.com.
BersonDeanStevens (BDS) has been developing creative results-driven marketing strategies, content, campaigns, and programs for over 25 years. And, we bring the knowledge and expertise to incorporate AI when necessary to gain efficiencies and help boost results. Whether you’re looking for a fractional CMO and/or CCO, need assistance when your internal workforce is overloaded, or need consulting from time to time, BDS is the perfect go-to resource. Client list.

by Lori Berson | Sep 11, 2024 | Creative Services, Marketing, Marketing Strategy
Creativity isn’t just a luxury; it’s a necessity. Whether you are a business owner or a marketer, the need to stand out from the competition and create a memorable brand experience is more pressing than ever. One of the smartest ways to enhance your company’s creative capacity is by bringing in a fractional Chief Creative Officer (CCO). This role is particularly valuable in delivering expert guidance without the full-time cost commitment, ensuring that your marketing strategies are aligned with your business goals and fueled by innovative ideas.
The Creative Edge That Sets You Apart
In an age where businesses are constantly competing for attention, creativity is often the defining factor that sets successful companies apart. A Fractional CCO provides fresh, innovative perspectives that can help breathe new life into your marketing campaigns. Their expertise allows them to identify creative opportunities that might be overlooked by internal teams focused on day-to-day operations.
Hiring a fractional CCO ensures you have a creative leader who can help your brand stay ahead of trends, enabling your business to not only keep up with competitors but to set the pace. They bring a wealth of industry experience, and their role is about more than just generating ideas—it’s about executing them in a way that drives real, measurable results. The ripple effect of having such creative leadership ensures that your brand maintains relevance and positions itself as a leader in the market.
Flexibility and Cost-Effectiveness
Hiring a full-time creative executive may not be feasible for many companies, especially when marketing budgets are stretched thin. A Fractional CCO offers a flexible, scalable solution that provides access to top creative talent without the long-term commitment. They integrate seamlessly with your team, injecting fresh ideas that are tailor-made for your brand’s unique needs. This flexibility ensures that your creative strategy adapts quickly to market shifts and emerging trends, keeping your business ahead of the competition.
This approach not only keeps costs down but ensures that your business is always equipped with the right creative leadership at critical moments. You get the benefit of strategic insights and high-quality creative work without the overhead of a permanent team member.
Strategic Creative Alignment Across the Organization
A Fractional CCO’s influence extends beyond just the marketing department. They play a pivotal role in aligning creativity with business strategy across various departments. From product development to customer service, a CCO ensures that every aspect of your business embodies your brand’s creative vision. By aligning efforts across departments, they create a unified brand experience that resonates with customers at every touchpoint.
For instance, by collaborating with sales and operations, a fractional CCO can ensure that creative ideas are not only innovative but also executable and scalable. Their ability to bridge the gap between departments creates a more cohesive and consistent brand message, which ultimately strengthens your market positioning.
Speeding Up Results with Long-Term Vision
One of the greatest advantages of working with a Fractional CCO is their ability to deliver quick results while keeping an eye on long-term goals. While they can quickly assess your current creative assets and identify opportunities, they also focus on building sustainable strategies that ensure ongoing success. Whether it’s optimizing your current campaigns or reimagining your brand, their impact is felt immediately. At the same time, their long-term vision ensures that these early successes build the foundation for sustainable growth.
In marketing, the right creative decisions can be the difference between a good year and a great one. A Fractional CCO brings the expertise to guide these decisions while also future-proofing your marketing efforts, ensuring that your brand continues to grow.
Why Your Business Needs a Fractional CCO
Hiring a Fractional Chief Creative Officer is a powerful way to drive creativity, innovation, and growth in your business. They offer expert-level insights, ensuring that your marketing strategies are not only aligned with your business goals but also creatively inspiring. For business owners and marketers looking to stay ahead in an increasingly competitive marketplace, a fractional CCO can help you achieve sustainable success by leveraging creativity as a competitive advantage.
Ready to lead with creativity? Schedule a call or email Lori at lberson@BersonDeanStevens.com to help guide your next marketing campaign and witness the transformative impact creativity can have on your business.
BersonDeanStevens (BDS) has been developing creative results-driven marketing strategies, content, campaigns, and programs for over 25 years. And, we bring the knowledge and expertise to incorporate AI when necessary to gain efficiencies and help boost results. Whether you’re looking for a fractional CMO and/or CCO, need assistance when your internal workforce is overloaded, or need consulting from time to time, BDS is the perfect go-to resource. Client list.

by Lori Berson | Aug 12, 2024 | Marketing, Marketing Strategy
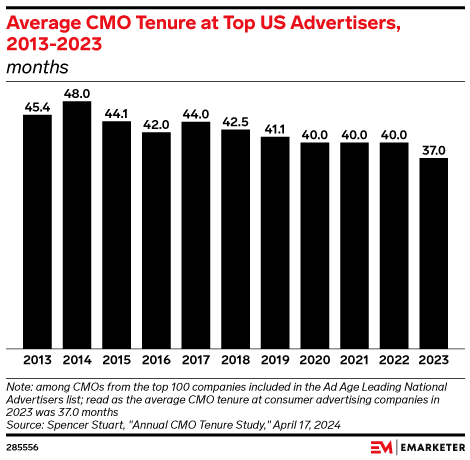
In 2023, the average CMO tenure at top US advertisers was three years and one month, significantly lower than a decade ago, according to data from Spencer Stuart. With high turnover, tight marketing budgets, and new technologies like generative AI, companies are hiring fractional CMOs—contracted marketing leaders who provide part-time, strategic, and implementation services.
Fractional CMOs integrate deeply into companies, unlike marketing agencies or interim CMOs. They typically work with smaller firms that can’t justify a full-time CMO and provide strategic leadership on a part-time basis to increase efficiency and productivity, avoiding time-draining tasks. This model is becoming increasingly popular, providing companies with access to senior marketing expertise without the commitment of a full-time executive salary.
Companies can find fractional CMOs through LinkedIn or fractional CMO networks, but they should clearly understand their needs first. Some fractional CMOs specialize in strategy, requiring additional hires for execution. Firms should look for CMOs who can both strategize and implement.
Skills specialization is crucial, especially with generative AI. Hayden Brown, CEO of Upwork, emphasizes the need for top-level AI expertise in companies. Fractional CMOs can fill this role, particularly during periods of rapid change, such as business model shifts, new product introductions, or preparations to go public.
Fractional CMO Advantages
- Expertise on Demand: Fractional CMOs bring a wealth of experience from diverse industries and backgrounds, offering fresh perspectives and innovative solutions.
- Cost Efficiency: With the ability to hire on a part-time or project basis, companies can manage budgets more effectively while still leveraging top marketing talent.
- Flexibility and Scalability: The fractional engagement allows businesses to adapt quickly to market changes and scale marketing efforts up or down based on current needs and budgets.
Potential Challenges
While the benefits are significant, there are some challenges to consider:
- Cultural Fit: A Fractional CMO might not be as embedded in the company culture, which can impact team dynamics and long-term strategy alignment.
- Divided Attention: Managing multiple clients can lead to conflicts in prioritization and focus, potentially diluting the impact on your business.
Choosing the Right Fractional CMO
Selecting the right Fractional CMO involves a strategic alignment with your company’s vision and goals. It’s crucial to define clear objectives and success metrics from the beginning and ensure regular communication and stakeholder engagement to maximize the effectiveness of the partnership.
For businesses navigating critical transformations or looking to scale efficiently without the overhead of a full-time position, a Fractional CMO is an excellent investment. By understanding both the benefits and potential pitfalls, companies can make informed decisions that align with their long-term marketing strategies and overall business objectives.
Ready to elevate your marketing strategy without the overhead of a full-time executive? Schedule a call or email Lori at lberson@BersonDeanStevens.com to discover how a Fractional CMO can drive your business forward.
BersonDeanStevens (BDS) has been developing creative results-driven marketing strategies, content, campaigns, and programs for over 25 years. And, we bring the knowledge and expertise to incorporate AI when necessary to gain efficiencies and help boost results. Whether you’re looking for a fractional CMO, need assistance when your internal workforce is overloaded, or need consulting from time to time, BDS is the perfect go-to resource. Client list.