![Podcast Engagement [Research]](https://bersondeanstevens.com/wp-content/uploads/2022/05/Podcast-1080x675.jpg)
by Lori Berson | May 6, 2022 | Marketing, Podcasts
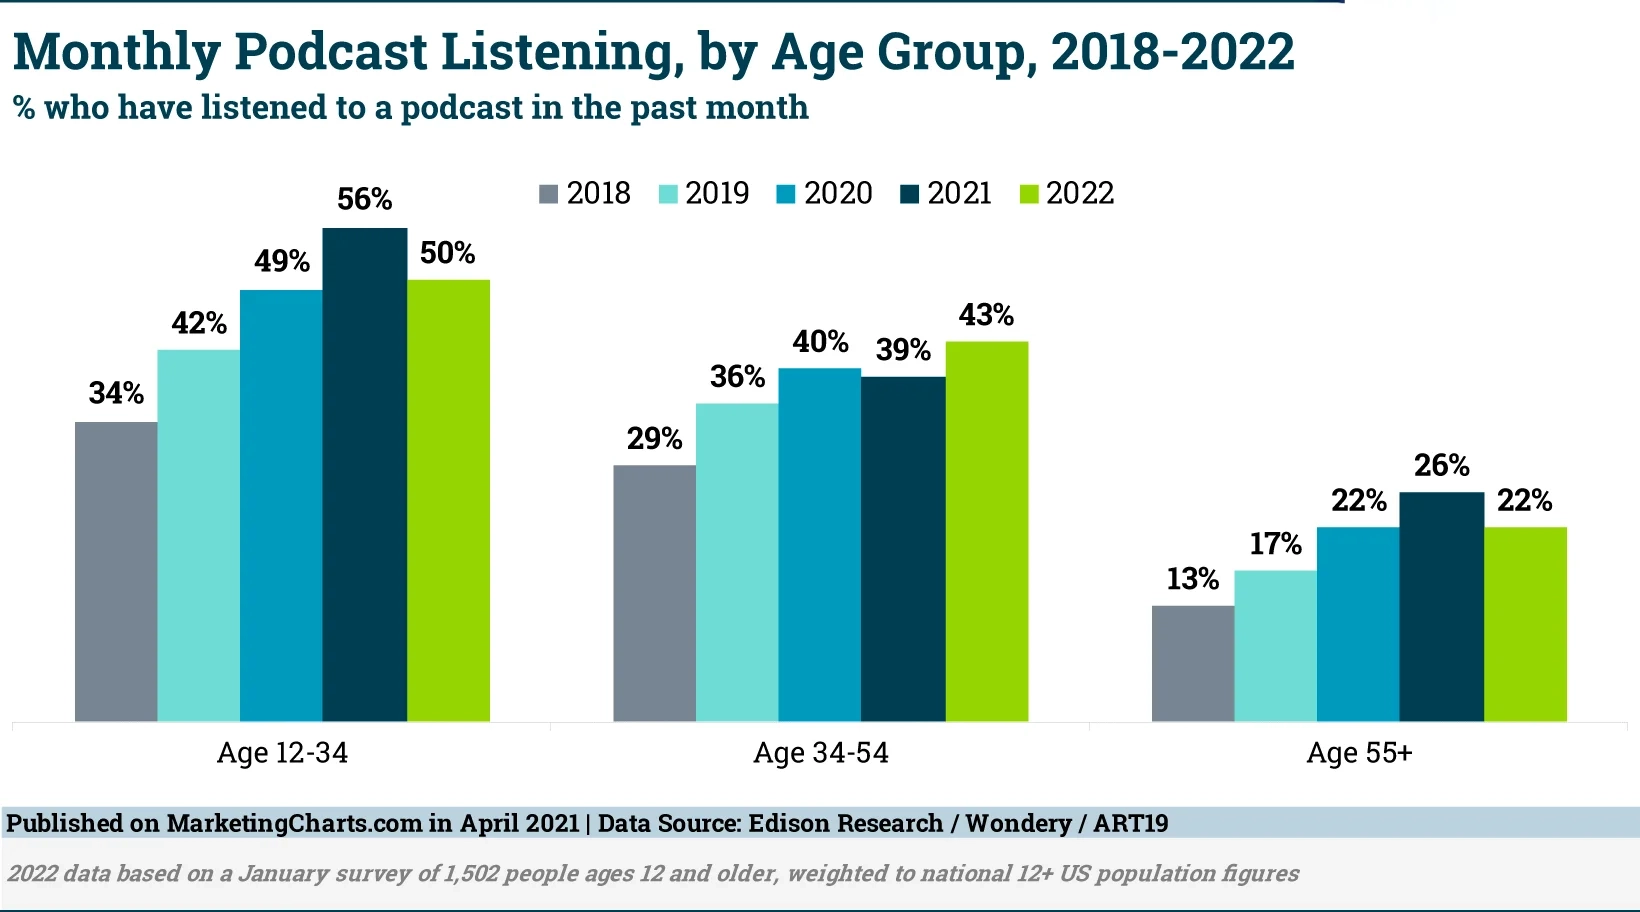
According to results from the latest Edison Research Infinite Dial report, produced in partnership with Wondery and ART19, podcasts have are increasingly popular with middle-aged adults.
Mixed Trends in Podcast Reach
This 2022 report finds that 79% of US respondents ages 12 and older are familiar with podcasting. The podcast audience also continues to expand, as 62% of respondents say they’ve ever listened to a podcast. This figure has climbed virtually every year since 2006, and is up from 40% in 2017.
However, while more people have listened to a podcast than ever before, regular engagement with podcasts has slipped, which the report attributes to a return to pre-pandemic routines. As such, this year 38% of respondents report having listened to a podcast in the last month, down from 41% in last year’s survey. However, this figure remains higher than those registered in 2020 (37%) and 2019 (32%) as well as in prior years.
Likewise, weekly podcast listening has also dipped slightly. This year 26% report having listened to a podcast in the previous week, as compared to 28% last year. Once again, this year’s result continues to be higher than in 2020 (24%), 2019 (22%) and earlier years.
Middle-Aged Adults Go Against The Trend
The percentage of Americans ages 13 and older who listen to podcasts on a monthly basis declined across age groups and genders, with one exception: 35-54-year-olds. Instead, the proportion of Americans in this age group having listened to a podcast in the previous month ticked up from 39% last year to 43% this year. By comparison, the percentage of 12-34-year-old respondents listening in the past month fell from 56% to 50%, while for those ages 55 and older it dropped from 26% to 22%.
Meanwhile, slightly fewer male respondents this year (41%) than last (43%) had listened to a podcast within the prior month, with engagement also dipping among female respondents (39% to 36%).
Another measure of podcast listening also shows that the middle-aged group is heavily engaged. Though the report doesn’t break out the percentage of respondents who listened to podcasts in the previous week by age group, it does look at the number of podcasts listened to among weekly podcast listeners by age. The results here show that although one-third (33%) of weekly listeners ages 12-34 listen to more than 5 episodes in the previous week, that figure rises to 38% among 35-54-year-olds. Indeed, the number of episodes that weekly podcast listeners tuned into during the prior week averaged 8.9 among the 35-54 bracket, compared to 8.3 for the 12-34 group and 4.9 for the 55+ group.
Recent study results suggest that Comedy is the most popular genre among 25-54-year-old podcast listeners, followed by News, Society & Culture, and True Crime.
The Monthly Podcast Listener
Men are over-represented in the monthly podcast listening audience, according to the Infinite Dial report. While they account for 48% share of the 12+ population, they represent 53% of monthly podcast consumers of that age, compared to 46% share for women and 1% for non-binary/other. However, men’s share of the monthly podcast listening audience has edged down over the years, from 55% in 2017. A recent Nielsen report has also found an increase in female listeners, noting that the number of heavy female listeners – those tuning in 10+ times per month – almost doubled between November 2019 (5.38 million) and November 2021 (9.27 million).
As for the age distribution of monthly podcast listeners, a declining share are ages 12-34 (47%, down from 51% in 2017). The share who are aged 35-54 remains flat from 2017 at 33%, while the share who are aged 55 and older has grown from 16% to 20% during that period. This also aligns with research from Nielsen, in which adults ages 55 and older have been found to represent a growing share of the podcast audience at the expense of younger adults.
As for the race/ethnicity of monthly podcast listeners, this year’s study finds that 59% are White, down from 66% in 2017. Some 16% are African-American, up from 12%, while another 16% are Hispanic, up from 11%.
Online Audio Engagement Rises
Unlike with podcasting, the percentage of US respondents ages 12+ who listened to online audio in the previous month rose this year, reaching 73% after spending the past couple of years at 68%. The rise was particularly noticeable among the 35-54 (81%, up from 72%) and 55+ (52%, up from 46%) age groups.
Weekly online audio listening (referring to AM/FM radio stations online and/or streamed audio content available only on the internet) also climbed to reach two-thirds (67%) of respondents, up from 62% last year and 60% the two years prior.
About the Data: The results are based on a January survey of 1,502 people in the US ages 12 and older.
Need assistance with podcast production and promotion? Schedule a call or email Lori Berson at lberson@BersonDeanStevens.com.
BersonDeanStevens has been a recognized brand strategy and marketing leader for over 25 years, including over a decade in marketing and sales automation. We work in partnership with you to differentiate your brand and achieve your business goals. Client list.
![How Marketers Are Using Marketing Automation Tools [Report]](https://bersondeanstevens.com/wp-content/uploads/2022/05/Marketing-Automation.jpeg)
by Lori Berson | May 5, 2022 | Marketing, marketing automation
Per an Ascend2 report, marketers mention several advantages of using marketing automation, chief among them are improvements in the customer experience and better use of staff time. And automation has also been linked to a stronger ability to prove ROI as well as increased coordination between marketing and sales teams. With these benefits, almost one-third of marketers surveyed by Ascend2 say they’ll be shopping for a new solution in the coming year.
Some 31% said they’ll be shopping for a solution, versus 26% who won’t be in the market. (The remaining 43% are unsure.) The results are interesting in light of a 2021 report indicating that 2 in 3 marketers had replaced a martech tool in the previous year, with marketing automation the most likely to have been replaced (by 24%).
Automation Usage Trends
The Ascend2 study suggests that there is some room for improvement in automation of the customer journey. While close to 1 in 3 respondents say their customer journey is either fully (9%) or mostly (22%) automated, for a majority – 47% – the overall customer journey remains only partially automated. In fact, for 1 in 5 (22%) the customer journey isn’t automated at all.
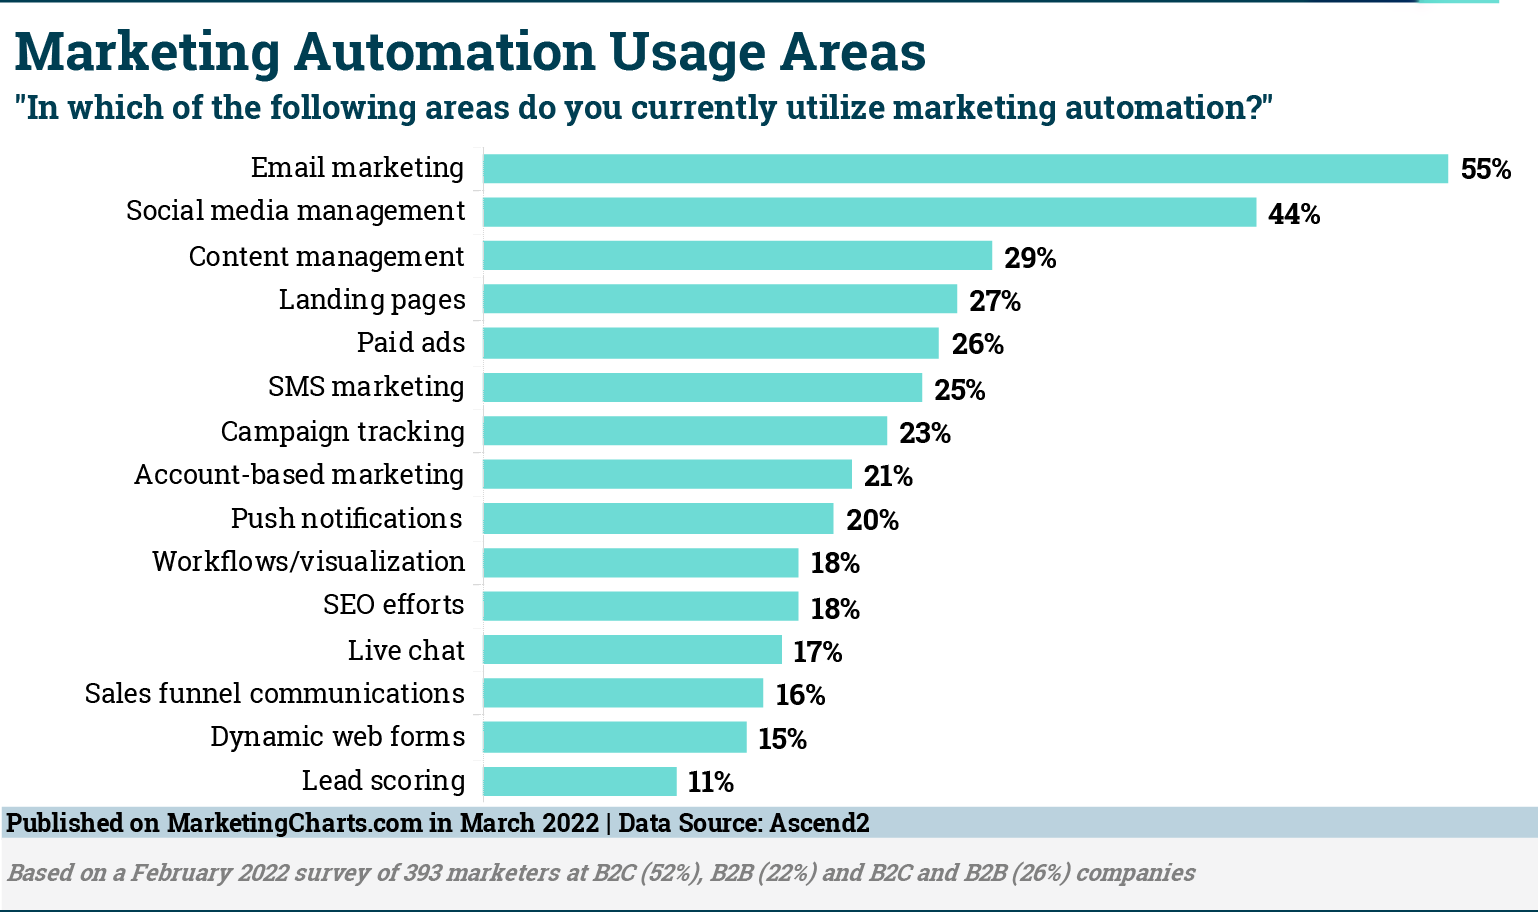
Looking at the areas in which automation is being deployed, the report finds that email marketing (55%) is the most widely used, much as it is the most broadly used for personalization. This was the only area for which a majority of marketers reported using automation.
Following email is social media management (44%), which was also the second-most utilized area for automation after email last year. However, after that content management is the third-most this year, as opposed to paid ads last year. Landing pages remain relatively high on the list, as do paid ads, while SMS marketing jumps up this year. Relative to last year, there seem to be fewer marketers putting automation to use in their lead scoring.
Using AI with Automation
While automation can improve efficiencies, adding artificial intelligence (AI) can help to further improve the customer experience.
The survey asked respondents in which areas they are currently testing or utilizing AI in conjunction with their marketing automation. The areas that emerged at the top were paid advertising (32%) and personalizing email messages/offers (32%). Not surprisingly, AI is being leveraged in areas where automation is more broadly used.
Meanwhile, about 1 in 5 report using or testing AI in conjunction with automation for product/content recommendations, email subject line personalization, predictive analytics, and account identification.
Other Findings:
- Price (58%) and ease of use (54%) are the most widely cited primary factors driving the purchase decision of a marketing automation tool, much as they have been in years past.
- Marketers are more likely to describe the success of their marketing automation at achieving important objectives as “very successful” (22%) than “unsuccessful” (14%). For the majority (64%), their marketing automation has been “somewhat successful” in meeting their goals.
- 7 in 10 respondents report that it is either extremely (11%) or somewhat (59%) easy to measure the success of marketing automation in meeting their objectives.
About the Data: The results are based on a survey conducted in February 2022 among 393 marketers, half (52%) of whom count B2C as their primary marketing channel. The remainder primarily target B2B (22%) or B2B and B2C equally (26%). Some 43% of respondents work at companies with at least 50 employees.
Need assistance with marketing automation platform selection, onboarding and/or optimization? Schedule a call or email Lori Berson at lberson@BersonDeanStevens.com.
Also, check out our agency listing on Design Rush.
BersonDeanStevens has been a recognized brand strategy and marketing leader for over 25 years, including over a decade in marketing and sales automation. We work in partnership with you to differentiate your brand and achieve your business goals. Client list.
![What Makes Content Memorable and Enables a Sales Call [Survey]](https://bersondeanstevens.com/wp-content/uploads/2022/05/Memorable-Contentshutterstock_353241029.jpeg)
by Lori Berson | May 4, 2022 | Content Marketing, Marketing, Sales Enablement
A majority of B2B buyers consume 3-5 pieces of content before engaging with a salesperson when making a purchase decision, although 3 in 10 consume more than 5 pieces of content, according to Demand Gen’s B2B Content Preferences Survey Report. With content consumption playing a key role in predicting purchase behavior, it’s helpful to see what buyers want from content.
Research & Data Are Key for Content Sharing
The report indicates that B2B buyers pay close attention to content that includes research and data, and that this is a factor in their decision of whether or not to share content. When they were asked the key drivers for sharing content, respondents pointed first to its inclusion of relevant/shareable links that can be immediately shared (48%), and then next they preferred the content be loaded with shareable stats and quick-hitting insights (42%).
In fact, the presence of data seems to be a driver of sharing for more respondents than the ability of that data to influence others: about 4 in 10 said that a motivation to share content was that it tells a strong story that resonates with the buying committee (41%), while fewer said that shareworthy content is that which will influence peers/other internal stakeholders on the buying team (34%).
B2B buyers participating in the study indicated that they were more likely to share research/survey reports (45%) with their colleagues than other popular types of content including e-books (43%), webinars (42%), and case studies (40%).
The results bring to mind recent research from Muck Rack, in which journalists said that two factors that make a story shareable are it containing an image or infographic, and it having exclusive and/or surprising data.
Data Makes Content Memorable
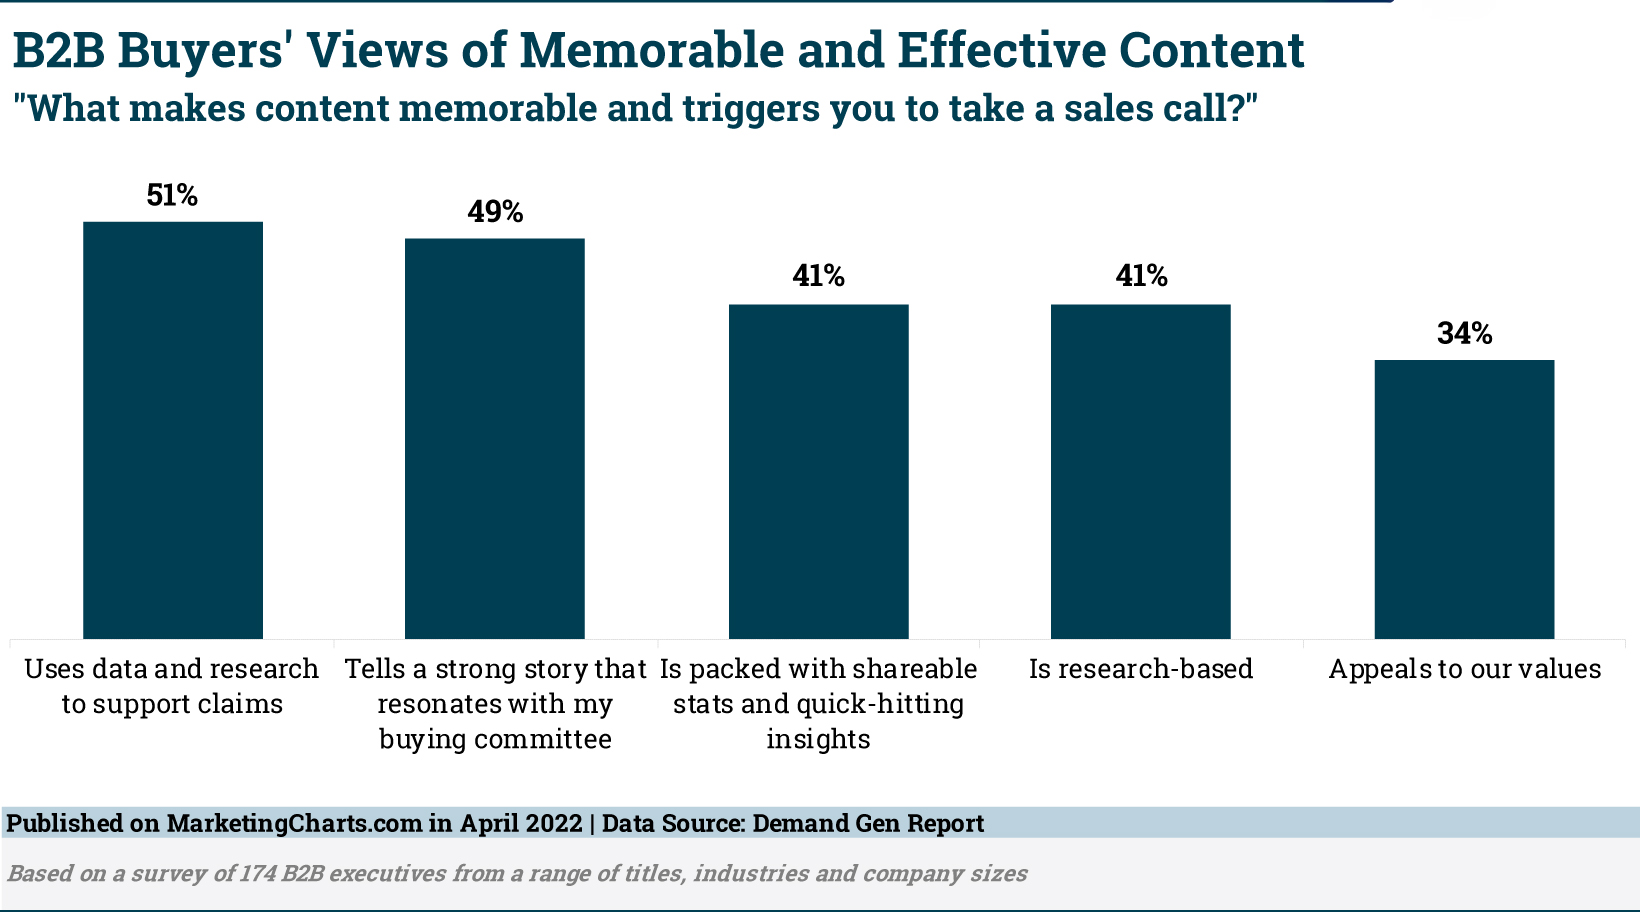
The survey also asked buyers what makes content memorable and triggers them to take a sales call. Once again, research and data figured prominently, with the top response being that the content uses data and research to support claims (51%). Some 4 in 10 also said that what makes a piece of content memorable is that it is packed with shareable stats and quick-hitting insights (41%) and that it is research-based (41%). The only other key element cited for content that triggers a buyer to take a sales call is that it tells a strong story that resonates with the buying committee (49%).
Not surprisingly then, a sizable share of buyers (36%) would recommend that B2B vendors use more data and research in order to improve their content quality. Other recommendations included curbing the sales messages (39%), creating shorter content (37%), and not overloading content with text (36%). In other words, as Demand Gen Report notes, “B2B buyers crave concise, research-based content.”
About the Data: The results are based on a survey of 174 B2B executives from a range of titles, industries, and company sizes.
Need assistance developing and implementing your content marketing strategy? Schedule a call or email Lori Berson at lberson@BersonDeanStevens.com.
BersonDeanStevens has been a recognized brand strategy and marketing leader for over 25 years, including over a decade in marketing and sales automation. We work in partnership with you to differentiate your brand and achieve your business goals. Client list.
![The Most Valuable Content Marketing Formats for B2B [Survey]](https://bersondeanstevens.com/wp-content/uploads/2022/05/Content-Marketing-1080x675.jpg)
by Lori Berson | May 3, 2022 | Content Marketing, Marketing
According to Demand Gen’s B2B Content Preferences Survey Report, B2B buyers say they’ve been placing a higher emphasis on the trustworthiness of the source of the content they’ve consumed over the past year. Below are the buyers’ content consumption preferences per the report.
Webinars Are Still Popular
Although there are signs of online event fatigue, webinars are still effective. Of the 174 B2B executives surveyed for the report, two-thirds (67%) said they had consumed webinars during the previous year. This was the top format, ahead of e-books (56%), research/survey reports (55%), blog posts (54%), white papers (52%), and case studies (49%).
It’s no wonder then that recent research finds B2B marketers saying that webinars are their most effective top-of-the-funnel demand generation tactic. They may also be key for the later stages of the funnel, too, as they’re more likely than some other formats to be associated with an immediate buying decision.
Webinars Are Well Suited for Mid-Stage of the Funnel
The report indicates that buyers are more reliant on content in the early- to mid-stages of their journey, as each of the 16 content formats examined for the study were said by buyers to grab their highest engagement at those stages.
A majority said that infographics (62%), blog posts (58%), and podcasts (56%) are most valuable at the early stage of the funnel. Despite the above-cited results, 48% of buyers said that webinars are most valuable at the mid-stage of the funnel, compared to 41% who find them most valuable at the early stage and 11% at the late stage.
This is supported by research from MarketingCharts in partnership with Active Marketing Services, in which B2B demand gen marketers said that blogs and infographics are most effective at the top of the funnel, while webinars are most effective mid-funnel. The only content format that a plurality of respondents believed was most effective at the bottom of the funnel was the in-depth white paper or e-book.
Research Reports Help in Purchase Research
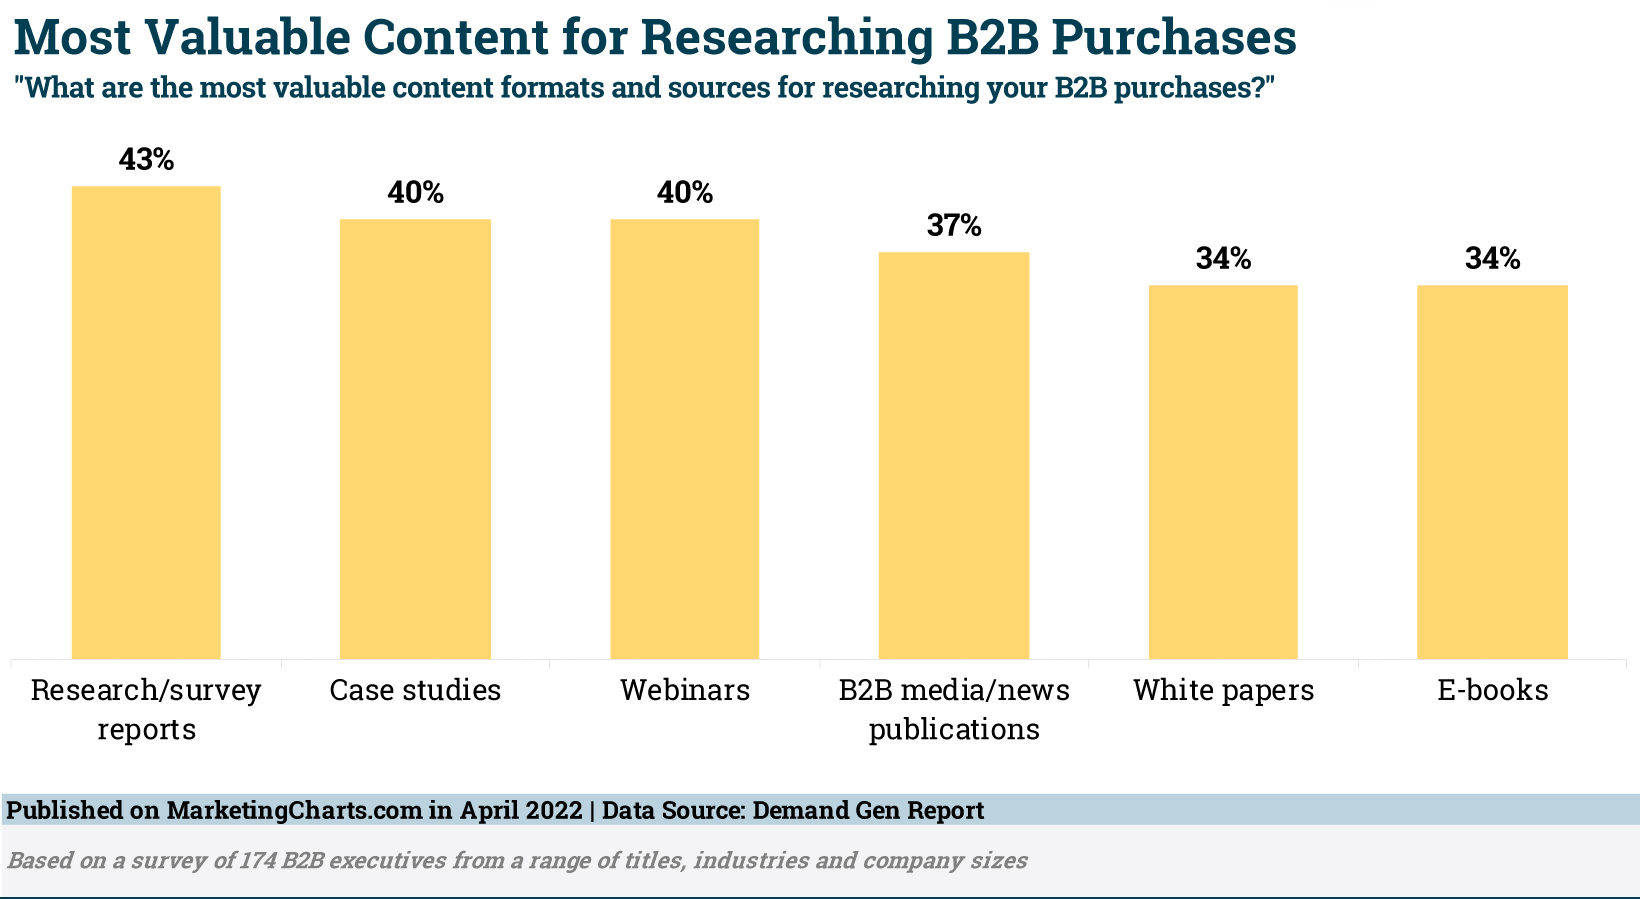
While buyers are most apt to have attended webinars over the past year, webinars are not the format they’ve found most valuable for researching their purchases. Research/survey reports were cited by more than 4 in 10 respondents, narrowly ahead of case studies and webinars. Separately, respondents noted that research-based content that includes shareable stats gets their attention and proves memorable.
About the Data: The results are based on a survey of 174 B2B executives from a range of titles, industries, and company sizes.
Need assistance developing and implementing your content marketing strategy? Schedule a call or email Lori Berson at lberson@BersonDeanStevens.com.
BersonDeanStevens has been a recognized brand strategy and marketing leader for over 25 years, including over a decade in marketing and sales automation. We work in partnership with you to differentiate your brand and achieve your business goals. Client list.
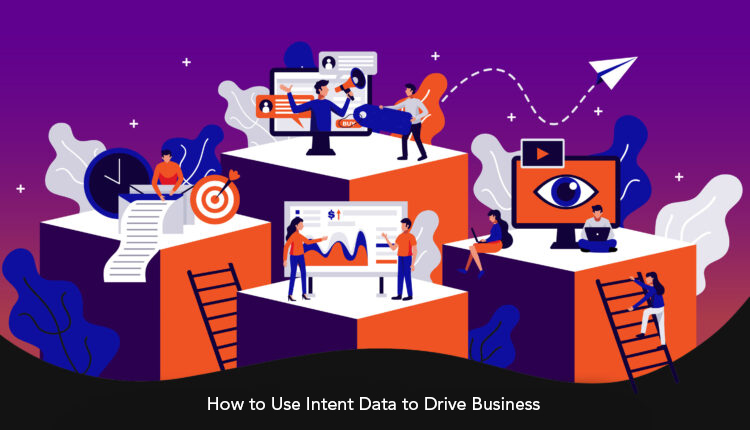
by Lori Berson | May 3, 2022 | Intent Data
Knowing what your target audience wants before they do, makes it easier than ever for you to convert them into paying customers. Intent data makes this possible. It’s one of the most powerful ways to research, find, and connect with your ideal customers.
What Intent Data Is
Intent data is information collected about a web user’s behavior/content consumption that provides insights into their interests. This insight often indicates potential intent to take a specific action. For businesses, that means understanding who might be getting closer to a buying decision or the nuances of the most common path towards a sale or conversion.
Where You Find Intent Data
First-party Intent data can be captured via your website or content libraries, while third-party Intent data providers monitor which of your potential customers are actively searching elsewhere online. This data is usually collected through a data co-op.
The buyers’ activity is scored based on the actions they take while navigating through various websites, looking at what topics are being researched and to what extent. The data is then translated into actionable insights for the sales and marketing teams.
Typically, these teams are alerted when their target clients are taking action online which would suggest their readiness to invest in the products and/or services their organizations offer. If used correctly, Intent data can help convert customers and drive sales more quickly and efficiently.
Different Types of Intent Data
Intent data uses activity indicators like IP addresses and browser cookies to track customer activity. There are two types of Intent data – first-party and third-party intent data.
First-Party Intent data
First-party Intent data is what you would most likely think of when you imagine tracking valuable insights about buyer activity online: what’s happening on your website. You likely already track first-party data through analytics tools, marketing automation platforms, or the backend of your own website.
This data is often anonymous, or you might be able to identify the business and individual with IP identification or previously submitted forms. The downside to depending solely on first-party Intent data is that you’re only gathering valuable customer data during one part of the buyer’s journey, and you could be overlooking ideal prospects that never make it to your website at all.
Third-Party Intent Data
Third-party Intent data observes buyer research everywhere else, so you can gather a more holistic view of your prospect’s activities. Customers typically don’t make one visit to one website to make a buying decision. It’s likely a series of events over time, with the majority of research happening before a buyer even visits your website.
While first-party intent data offers the visibility of one important step in the buyer’s journey, third-party intent data gives organizations a view into the entire path along the way.
Leading organizations pair first and third-party data as part of a holistic view of the buyer’s journey. Often the third-party data surfaces research first, which can help businesses get a jump on their competition and create a more personalized experience when the buyer actually arrives at the business’s website. If businesses only leverage data from prospect visits to their own assets, they may not capture customers who are only researching their competition.
How Intent Data is Used
Intent data can be used to launch and run more sophisticated sales and marketing programs. If you are able to better understand the pain points and interests of your target audience from the moment they begin the evaluation and research process of their buying journey, you can tailor your interactions to those needs and build more valuable connections.
From a tactical perspective, most businesses start using Intent data to help their sales development teams prioritize a list of target accounts to call on. More advanced organizations can create unique groups and targeted lists based on specific activities, and reach audiences in more personalized ways. If you can identify a prospect’s place in the sales cycle, you can feed them the highly-relevant content they need to overcome the next big hurdle in the buying process. When you are able to understand the challenges of your audience and provide a solution, it’s easier to build more meaningful and trusting connections that lead to sales. When used properly, intent data may significantly increase conversions and sales.
According to an Ascend2 Report and its Research Partners, the majority of marketers believe that the effectiveness of intent data has grown over the past year.
There’s still a way to go before achieving full integration of intent data: only 1 in 4 respondents said they have intent data implemented and integrated into their overall strategy, with others in the process of doing so (19%), are planning to (17%) or have not yet having started the process (19%). Just 1 in 5 either have no plans to use intent data or have stopped doing so.
There are various challenges to full integration of this data, first and foremost creating an overall strategy. Others pointed to obstacles integrating intent data with other data, deriving meaningful insights, and finding the right intent data solution.
A majority plan to up their intent data budget by up to 10% (42%) or more than 10% (12%), while a previous report found that for high-growth companies (primarily in the tech industry), intent data solutions represented the fastest-growing marketing technology category.
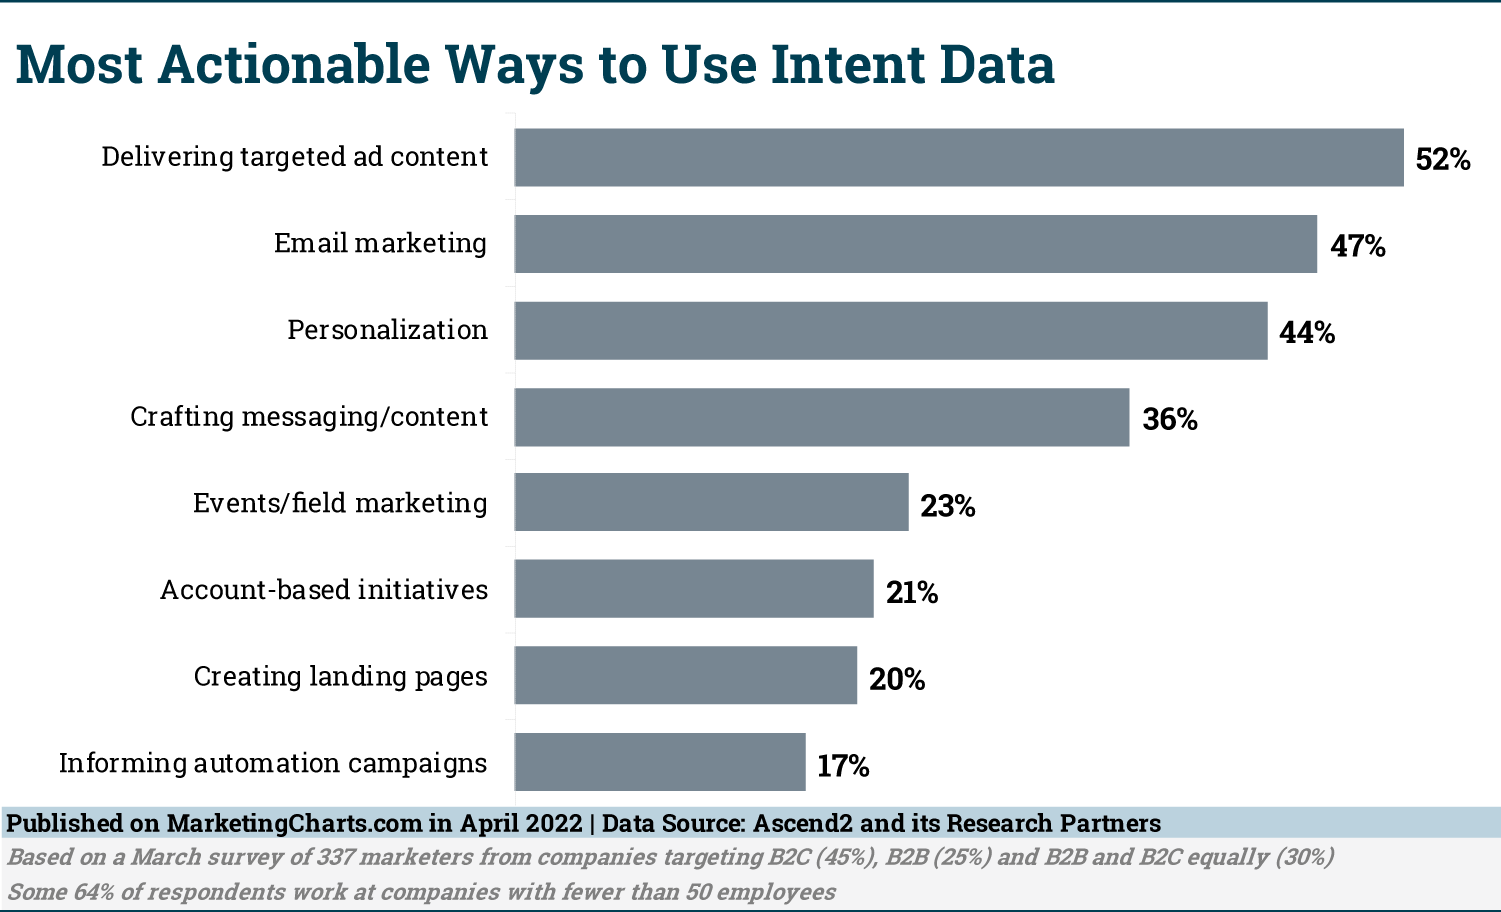
As for the most actionable ways to use intent data, respondents to the Ascend2 survey said that it is best for delivering targeted ad content (52%), email marketing (47%) and personalization (44%), while others pointed to its use for crafting messaging and content (36%).
About the Data: The results are based on a March survey of 337 marketers from companies targeting B2C (45%), B2B (25%) and B2B and B2C equally (30%). Some 64% of respondents work at companies with fewer than 50 employees.
Need assistance developing your marketing and intent data strategy? Schedule a call or email Lori Berson at lberson@BersonDeanStevens.com.
BersonDeanStevens has been a recognized brand strategy and marketing leader for over 25 years, including over a decade in marketing and sales automation. We work in partnership with you to differentiate your brand and achieve your business goals. Client list.
by Lori Berson | Apr 26, 2022 | Digital marketing, Marketing, Podcasts
EMarketer forecasts that US podcast ad spending will surpass $2 billion next year and $3 billion by 2026. Podcasts will account for over a quarter of digital audio services ad spending in 2022 and will be more than a third of spending by the end of 2026.
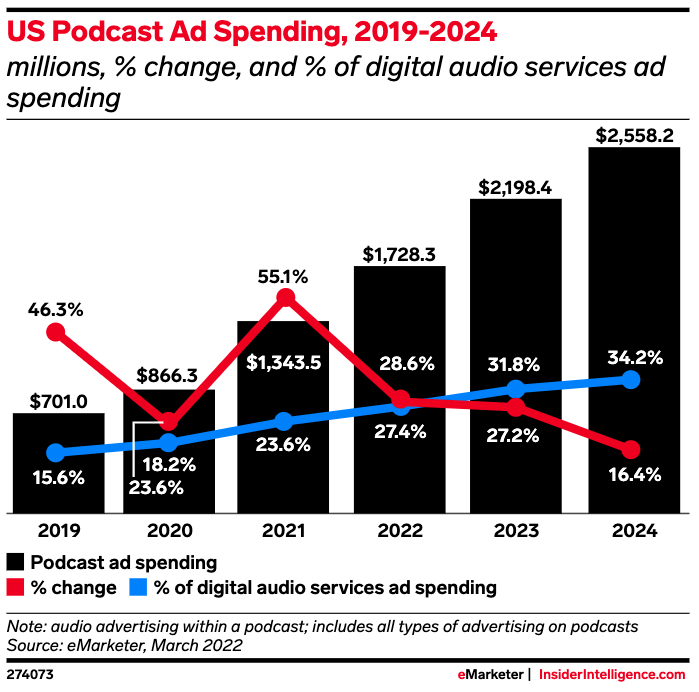
Most digital audio monetization will come from recorded music for the foreseeable future, but podcasts’ share of the market has grown—and will continue to do so. Previously only employed with experimental budgets, podcasts are becoming a crucial component of multimedia ad campaigns.
More than half of advertisers said they planned to increase their podcast ad budgets in 2022, according to a poll of 255 US advertisers conducted by Advertiser Perceptions in August 2021. Nearly half (46%) planned to keep their budgets the same, and just 1% planned to reduce podcast ad spending.
The survey also showed overall digital budgets were the most commonplace that advertisers pulled their podcast ad budgets from.
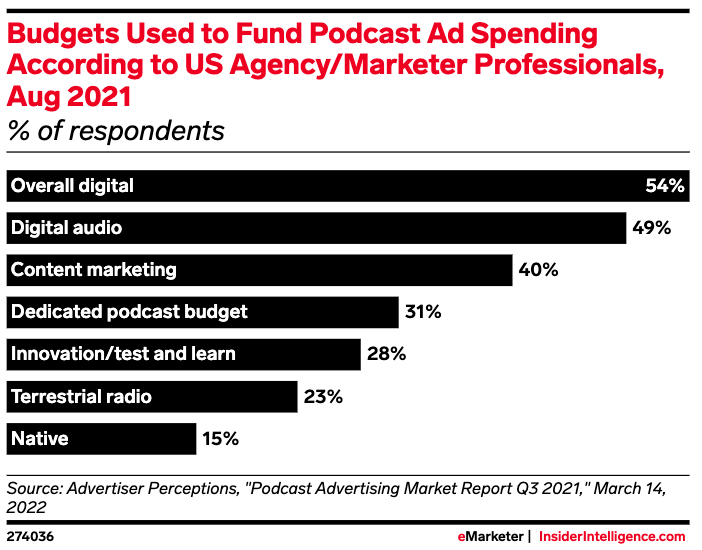
Most advertisers did not have dedicated podcast budgets. About half used their digital audio budgets to fund podcast campaigns. As podcast ad spending increases and accounts for a greater share of total audio ad dollars, more advertisers are expected to break out podcast-specific budgets. Having dedicated budgets could help centralize campaign planning and measurement for advertisers committed to podcasts over the long run.
Need assistance with your podcast marketing strategy and production? Schedule a call or email Lori Berson at lberson@BersonDeanStevens.com.
BersonDeanStevens has been a recognized brand strategy and marketing leader for over 25 years, including over a decade in Marketing Automation. We work in partnership with you to differentiate your brand and achieve your business goals. Client list.